
Economics 2011 Jamb Examination
Economics 2011 Jamb Examination

Question 1
The optimal range of output for a perfectly competitive firm is
In perfect competition, a firm aims to maximise profit by producing within the range where marginal cost (MC) is rising and above the average variable cost (AVC).
The optimal output occurs when the firm covers all its variable costs and part of its fixed costs, corresponding to the lowest point of AVC.
At this point, the firm achieves maximum efficiency before diminishing returns set in.
The optimal output occurs when the firm covers all its variable costs and part of its fixed costs, corresponding to the lowest point of AVC.
At this point, the firm achieves maximum efficiency before diminishing returns set in.
Not clear enough?
Question 2
If real income increases while nominal income remains the same, it can be inferred that
Real income measures purchasing power adjusted for inflation.
If nominal income remains constant but real income increases, it means that prices of goods and services have fallen, increasing the purchasing power of money.
This indicates a fall in the general price level or deflationary condition.
If nominal income remains constant but real income increases, it means that prices of goods and services have fallen, increasing the purchasing power of money.
This indicates a fall in the general price level or deflationary condition.
Not clear enough?
Question 3
Optimum population enables an economy to attain the highest level of
An optimum population is that population size which allows maximum utilisation of available resources to achieve the highest possible standard of living.
At this point, the output per capita or income per head is maximised.
Beyond this level, either overpopulation or underpopulation would reduce efficiency and welfare.
At this point, the output per capita or income per head is maximised.
Beyond this level, either overpopulation or underpopulation would reduce efficiency and welfare.
Not clear enough?
Question 4
The median of an odd-numbered set of scores is the
When data are arranged in order, the median is the middle value that divides the dataset into two equal halves.
For an odd number of scores, there is exactly one middle value, making it the median.
It is not influenced by extreme values unlike the mean.
For an odd number of scores, there is exactly one middle value, making it the median.
It is not influenced by extreme values unlike the mean.
Not clear enough?
Question 5
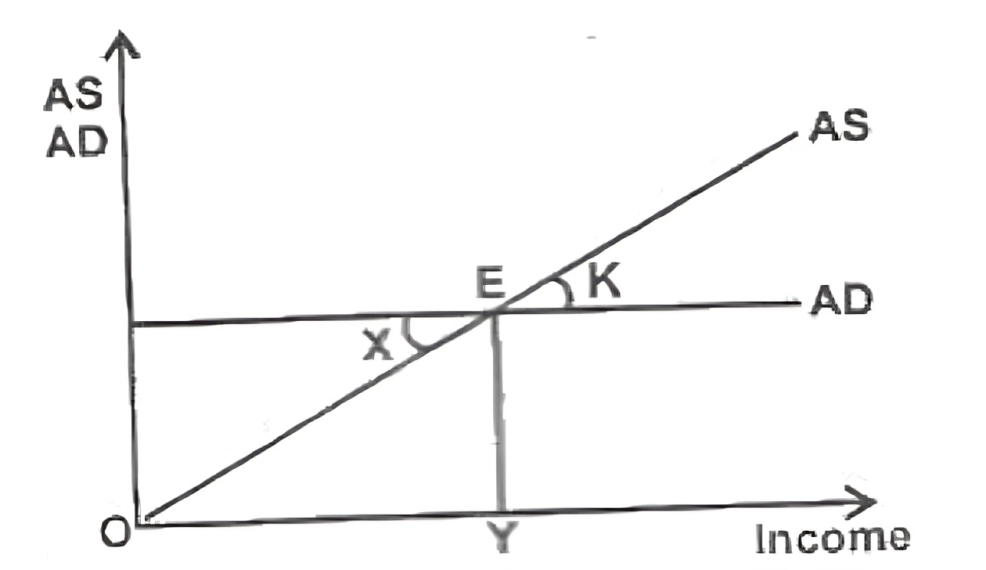
What does X represent?
In macroeconomics, a deflationary gap arises when aggregate demand is less than potential output, creating underutilisation of resources.
The diagram typically shows actual output (AD) below potential output (AS).
This shortfall, represented by X, is the deflationary gap.
The diagram typically shows actual output (AD) below potential output (AS).
This shortfall, represented by X, is the deflationary gap.
Not clear enough?
Question 6
| Price(₦) | Qty./(bag) |
| 1 | 60 |
| 2 | 120 |
From that table above, the price elasticity of supply is
Elasticity of supply (Es) = \(\dfrac{\text{Percentage change in quantity supplied}}{\text{Percentage change in price}}\).
From the table, price changes from 1 to 2 (a 100% increase) and quantity from 60 to 120 (also a 100% increase).
\(E_s = \dfrac{100}{100} = 1\).
This means supply is unit elastic.
From the table, price changes from 1 to 2 (a 100% increase) and quantity from 60 to 120 (also a 100% increase).
\(E_s = \dfrac{100}{100} = 1\).
This means supply is unit elastic.
Not clear enough?
Question 7
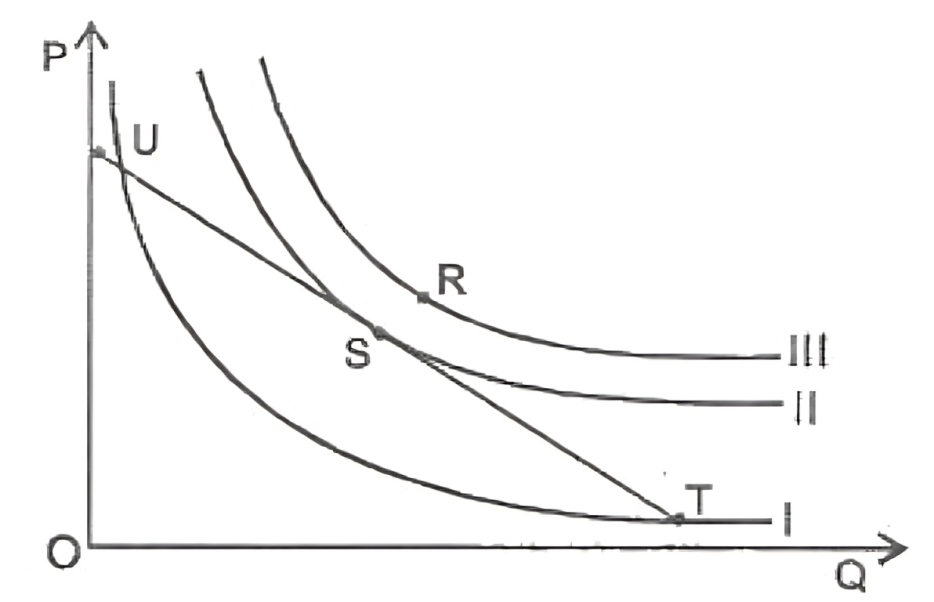
From the Diagram above, the optimal point of production is
The optimal production point occurs where the firm achieves both productive and allocative efficiency, often where MC equals MR.
From the diagram, point S represents this equilibrium condition, signifying the best combination of cost and output.
From the diagram, point S represents this equilibrium condition, signifying the best combination of cost and output.
Not clear enough?
Question 8
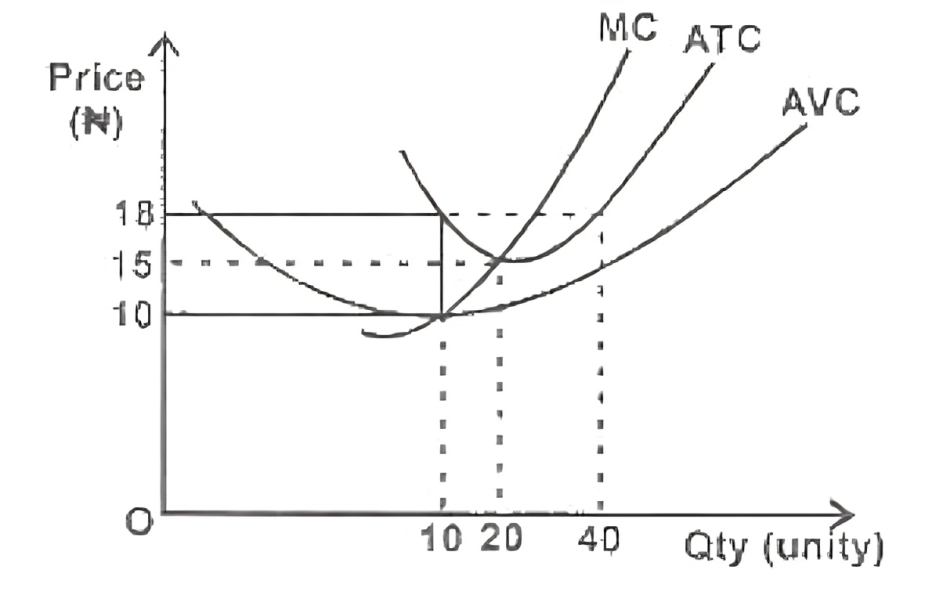
The average total cost when 20 units are produced is
From the cost curve shown, the average total cost (ATC) curve indicates the cost per unit at each level of output.
At 20 units of output, the ATC line corresponds to ₦15.00.
This reflects the average total expenditure incurred per unit produced at that quantity.
At 20 units of output, the ATC line corresponds to ₦15.00.
This reflects the average total expenditure incurred per unit produced at that quantity.
Not clear enough?
Question 9
When 20 units of output is produced, TC will be
Total cost (TC) = Average total cost (ATC) × Quantity.
From the graph, when 20 units are produced, ATC = ₦15.
Therefore, TC = 15 x 20 = ₦300.
This shows the total expenditure incurred in producing 20 units of output.
From the graph, when 20 units are produced, ATC = ₦15.
Therefore, TC = 15 x 20 = ₦300.
This shows the total expenditure incurred in producing 20 units of output.
Not clear enough?
Question 10
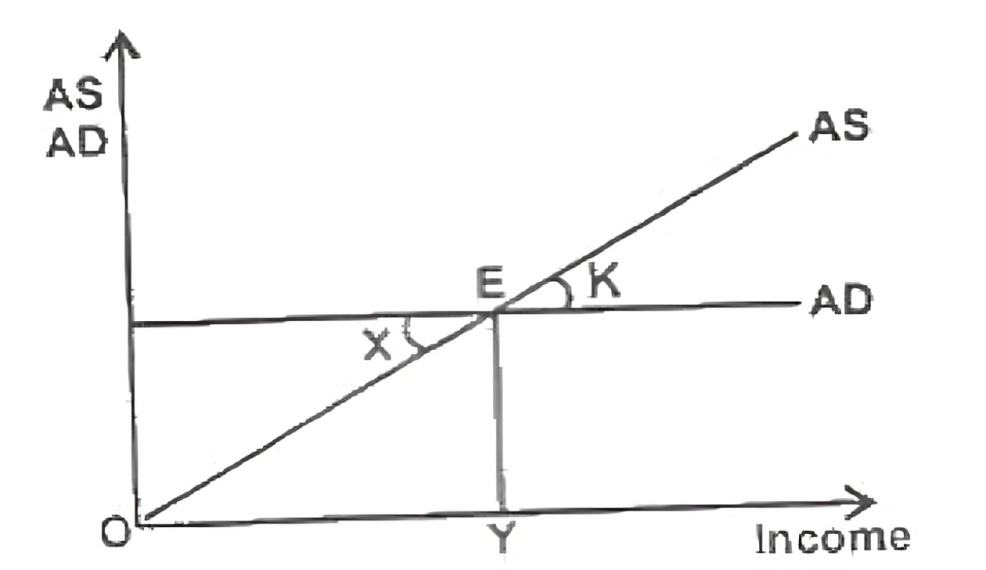
The deflationary gap is defined by
A deflationary gap represents the difference between the level of aggregate demand required to achieve full employment and the current level of demand.
On the diagram, this gap is denoted by X, showing the shortfall in total spending at full employment output.
On the diagram, this gap is denoted by X, showing the shortfall in total spending at full employment output.
Not clear enough?
You might like
The organs that will be most useful to giant African rats in finding their way in underground habitats are the
Using the name of one thing for something else with which it is closely associated in an instance is
If electrons are accelerated from rest through a potential difference of $10\ \text{kV}$, what is the wavelength of the associated electron?
[ $m=9.1\times10^{-31}\ \text{kg},\ e=1.6\times10^{-19}\ \text{C},\ h=6.6\times10^{-34}\ \text{J·s}$ ]
In the context of input substitution, if the Marginal Rate of Technical Substitution (substitution ratio) is exactly equal to the price ratio of the inputs, the total cost for producing a given level of output will be __________.