
Biology 2008 Jamb Examination
Biology 2008 Jamb Examination

Question 41
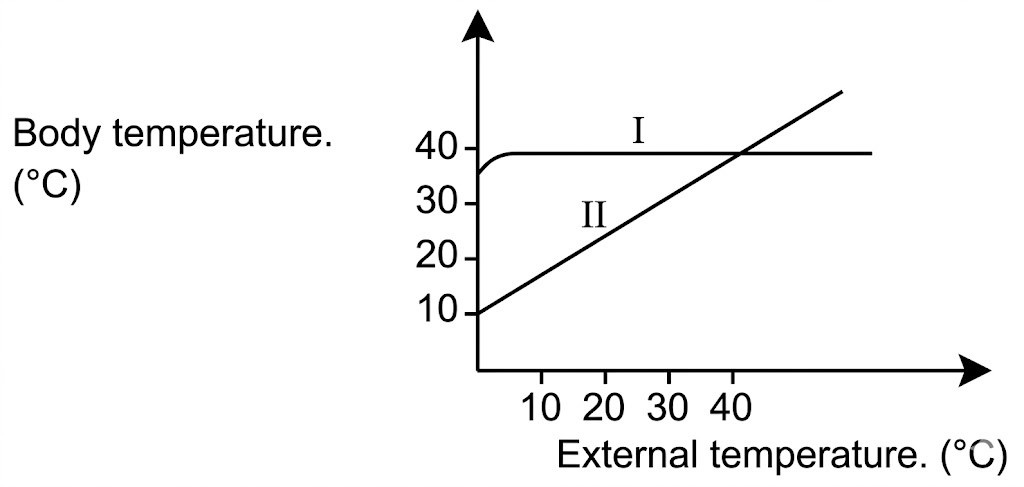
Use the diagram above to answer this question. The animal represented by l is a
an endotherm or a homoiotherm is an organism that can regulate its body temperature through metabolic activities.
Not clear enough?
Question 42
In the diagram, the illustration is a typical example of a plant pollinated by
The flower shown has bright colors, nectar guides, and a structure suitable for landing, which are adaptations for insect pollination. Insects transfer pollen while feeding on nectar, ensuring cross-pollination.
Not clear enough?
Question 43

In the diagram, the part labelled I represents the
Part I of the growth curve shows little or no increase in population size as microorganisms adjust to the new environment. This is known as the lag phase, during which metabolic activity is high but cell division is minimal.
Not clear enough?
Question 44
In the diagram, the part labelled IV indicated that the yeast population has
Part IV represents the death phase where the number of dying yeast cells exceeds the number of new cells formed due to depletion of nutrients and accumulation of toxic by-products, leading to a decline in population.
Not clear enough?
Question 45
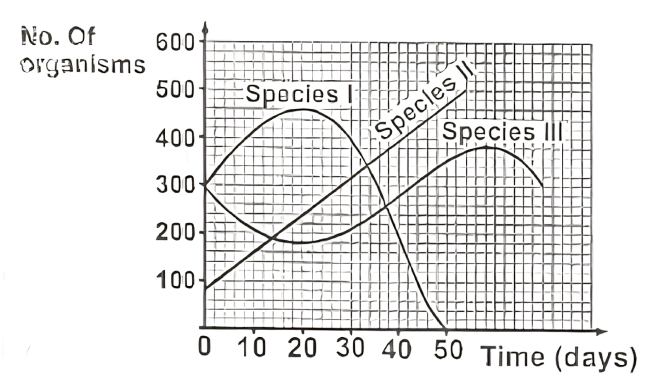
In the diagram, if species i, ii and iii interact in a community, which of the following statement is true?
the graph shows thatThe population of species I have become extinct.
Not clear enough?
Question 46
In the diagram, the population size of species II on the 20th day is
From the graph, the population size of species II on the 20th day can be read directly from the y-axis corresponding to day 20 on the x-axis. This indicates the population has reached 200 individuals at that point.
Not clear enough?
Question 47
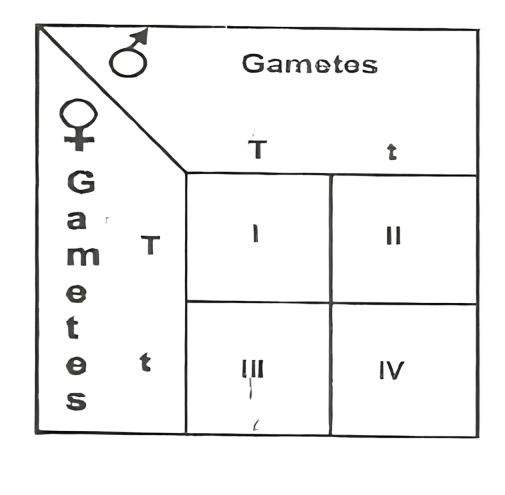
In the diagram, which of the four offspring of the cross will be short if T the gene for tallness is dominant to t?
Shortness is expressed only in the homozygous recessive genotype (tt). In the Punnett square, offspring IV carries tt and will therefore be short, while the others carry at least one dominant T allele.
Not clear enough?
Question 48
In the diagram, the genotypic ratio of the offspring of the cross is
The Punnett square shows one TT, two Tt, and one tt offspring. The genotypic ratio is therefore 1:2:1, representing homozygous dominant, heterozygous, and homozygous recessive individuals.
Not clear enough?
Question 49
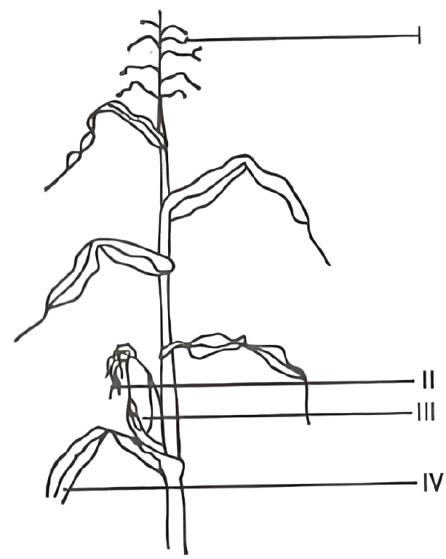
Use the diagram above to answer this question. The male inflorescence is labeled
The part labeled i is the male inflorescence also known as tassel.
Not clear enough?
Question 50
The natural process that produces adaptive evolutionary changes is
Natural selection is the process where organisms with advantageous traits survive and reproduce more successfully than others, leading to adaptive evolutionary changes in the population over time.
Not clear enough?
You might like
In a market situation where there is only one single seller of a commodity with no close substitutes, it is classified as a __________.
If your router is facilitating a CSU/DSU, which of the following commands do you need to use to provide the router with a 64000bps serial link?
The word in capital letters has the emphatic stress. Choose the option to which the given sentence relates.
Your mother CAN cook the meal.