
Economics 2024 Jamb Examination

Question 31
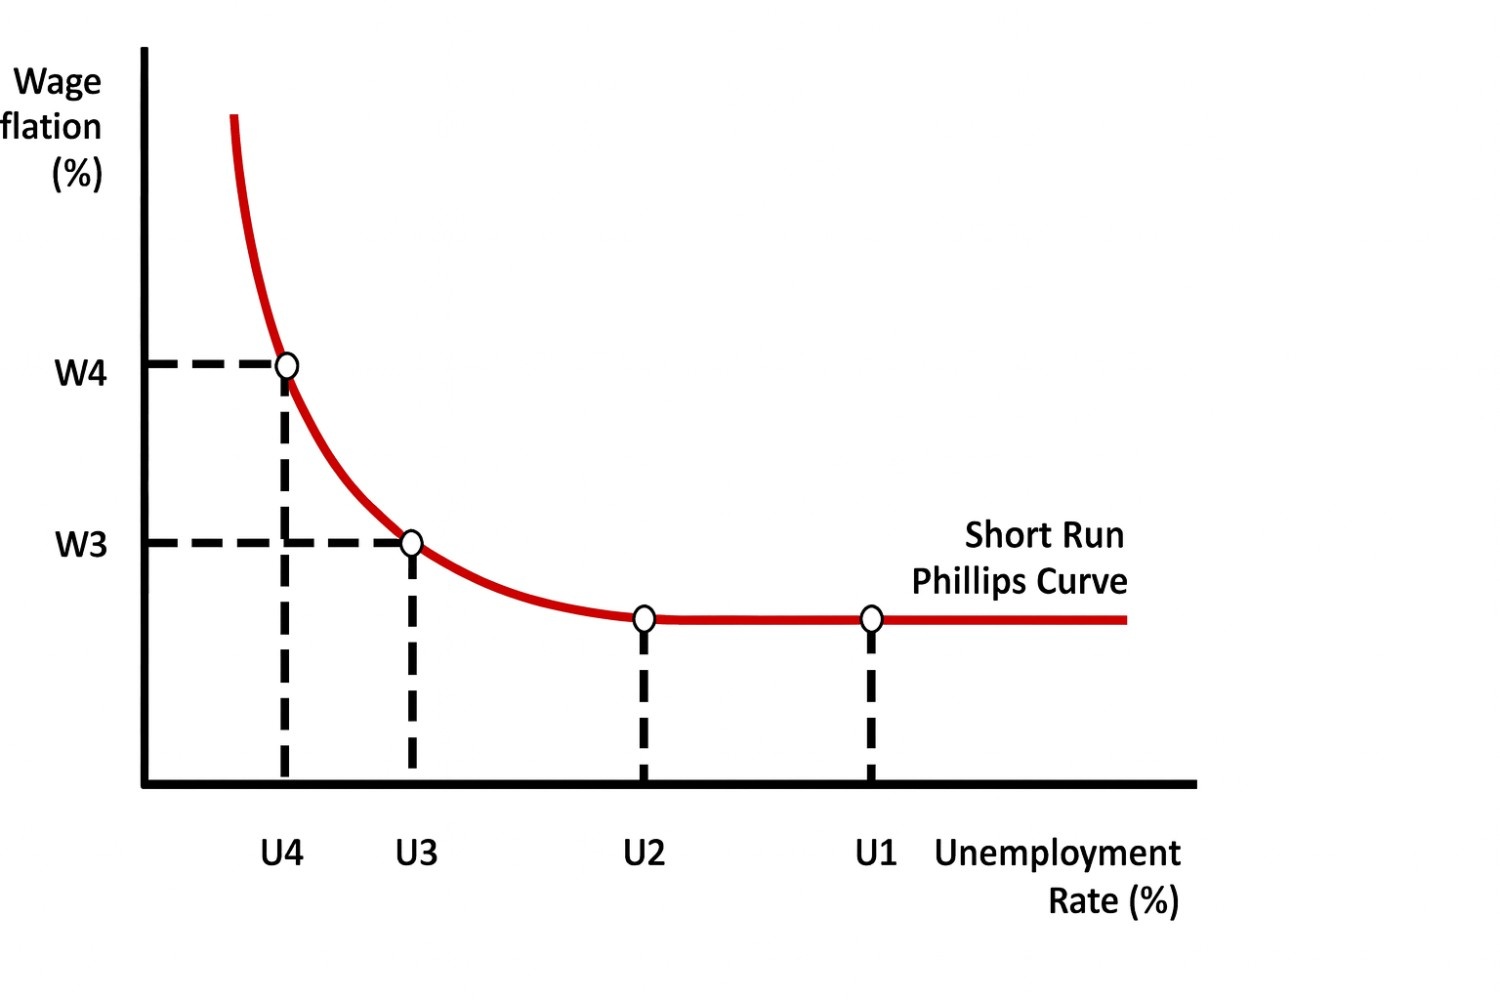
In labour economics, an inverse relationship between wage rate and unemployment is represented by the Phillips curve.
The Phillips curve demonstrates that when wage rates rise, unemployment tends to fall, and vice versa.
Thus, the diagram aligns with the relationship between wage rate and unemployment.
Not clear enough?
Question 32
Bargaining, trade unions, and lack of specialisation can occur within domestic markets, but natural barriers are external constraints typically associated with international trade.
Therefore, natural barriers are not associated with internal trade problems.
Not clear enough?
Question 33
The mean represents the arithmetic average, the mode is the most frequently occurring value, and variance measures the degree of dispersion.
The only measure that refers specifically to the middle term is the median.
Not clear enough?
Question 34
This may occur when consumers expect prices to rise in the future, causing them to buy more now despite higher prices.
Changes in taste, population size, or cost of raw materials do not produce an upward-sloping demand curve.
Therefore, the condition that leads to an exceptional demand curve is the expectation of future price increase.
Not clear enough?
Question 35
Change in quantity demanded:\[ 100 - 80 = 20 \]Percentage change in quantity:\[ \dfrac{20}{100} = 0.2 \]
Change in price:\[ 10 - 8 = 2 \]Percentage change in price:\[ \dfrac{2}{8} = 0.25 \]
Elasticity:\[ \text{Elasticity} = \dfrac{0.2}{0.25} = 0.8 \]The elasticity is less than 1, indicating inelastic demand.
Not clear enough?
Question 36
This includes consumption (C), investment (I), government expenditure (G), and net exports (X - M).
The correct form is therefore: \(Y = C + I + G + (X - M)\).
Only option B correctly includes consumption, investment, government expenditure, and net exports in their appropriate positions.
Not clear enough?
Question 37
This condition implies that the consumer has allocated income in such a way that utility is maximised, and no further adjustment is necessary.
It does not imply that total utility equals price, nor that more of the commodity must be consumed.
Therefore, the equality of marginal utility and price indicates consumer equilibrium.
Not clear enough?
Question 38
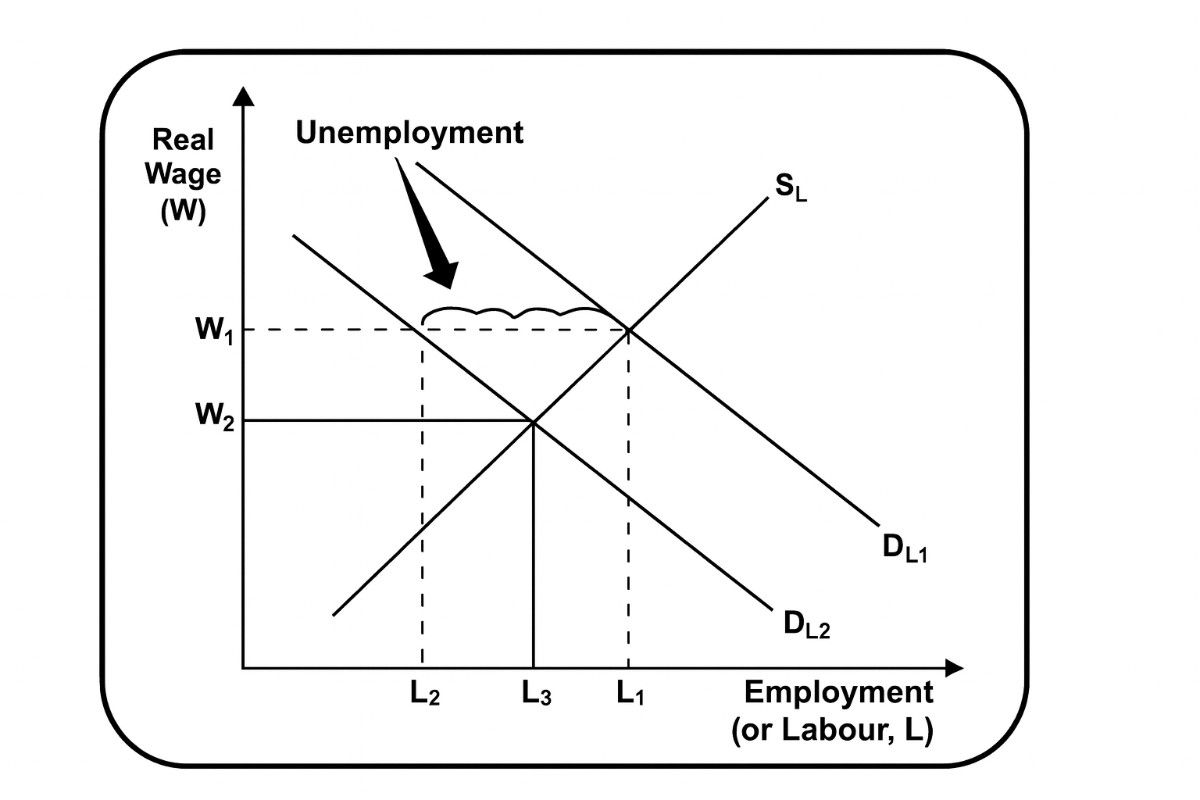
On the diagram, the intersection aligns horizontally with wage level W2, indicating the wage at which the quantity of labour supplied equals the quantity of labour demanded.
Other points, such as W1 or the labour quantities L2 and L3, do not represent the equilibrium point.
Thus, the equilibrium wage rate shown is W2.
Not clear enough?
Question 39
Opportunity curves are associated with production and trade-offs, not consumer satisfaction.
Utility curves show total utility, and demand curves show the relationship between price and quantity demanded.
The graph that captures equal satisfaction combinations is the indifference curve.
Not clear enough?
Question 40
Total national income figures, such as Gross or Net National Income, do not account for population differences.
Net disposable income is useful within a country but not ideal for international comparison.
Hence, per capita income provides a fair basis for comparing living standards between Nigeria and Ghana.
Not clear enough?
You might like
"Lift not the painted veil which those who live
Call life: through unreal shapes be pictured there,
And it mimic all we would believe
With colors idly spread,-behind, lurk fear." P.B. Shelley: Sonnet
The stanza above is an example of a
Use the information below to answer question
Jide and Haruna contribute N12000 each as capital and share profit equally. Jide draws N1500 and Haruna N1700 half-yearly. The profit for the year is N10000. Jide receives a salary of N2000.
Calculate the profit available for appreciation?
The table below gives the scores of a group of students. Find the mode of the distribution. \[ \begin{array}{|l|c|c|c|c|c|c|c|} \hline \text{Score} & 1 & 2 & 3 & 4 & 5 & 6 & 7 \\ \hline \text{Freq} & 4 & 6 & 8 & 4 & 10 & 6 & 2 \\ \hline \end{array} \]
Choose the option nearest in meaning to the underlined word(s).
His poetry is said to be inscrutable?